Around 65% of Google searches now end without a single click to any website. That number has been climbing for years, but the pace of change in 2026 is different. AI Overviews, Google AI Mode, ChatGPT, Perplexity, they’re all giving users answers before your page ever loads.
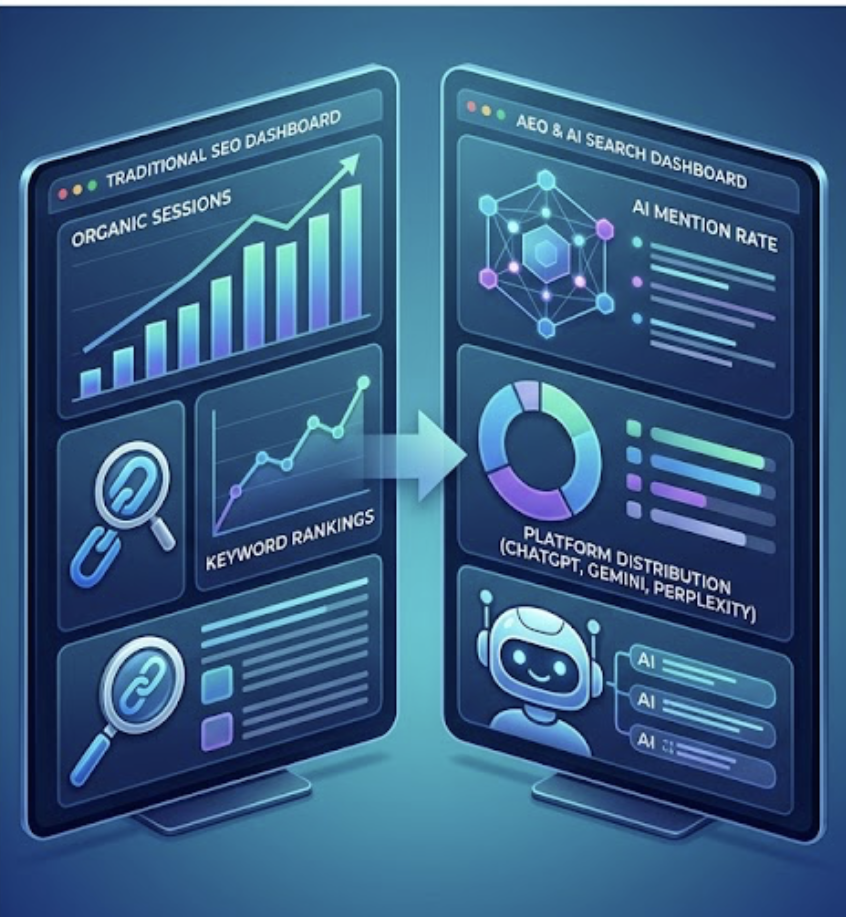
Your SEO dashboard wasn’t built for this. If it still shows keyword rankings and organic sessions and nothing else, you’re measuring the old game on a new board. The search landscape has split: some queries still send traffic the traditional way, but a growing share get resolved inside AI-generated answers where your ranking position doesn’t enter the picture.
Two sets of KPIs exist now. One for traditional search. One for AI search. You need both.
Why Your Current SEO Dashboard Is Only Half the Picture?
AI Overviews now appear on 48% of all tracked search queries, up 58% year-over-year per BrightEdge data from early 2026. When an Overview sits above your organic listing, the click math turns ugly. Seer Interactive analyzed 25 million impressions and found organic CTR dropped from 1.62% to 0.61% when an AI Overview was present. A 61% hit on your click potential.
Gartner projected a 25% drop in traditional search volume as users shift to AI assistants – and the data backs it up. Google AI Mode alone hit 100 million users in early 2026, running at a 93% zero-click rate.
The catch? There’s no stable ranking position in AI search. Between 40–60% of sources cited in Google AI Overviews change every month. You can’t monitor a “position 1” in ChatGPT the way you monitor a keyword rank. The measurement logic is totally different.
This doesn’t make your SEO KPIs obsolete. Traditional search still drives real traffic, especially for transactional and navigational queries. But measuring only the blue links means you’re blind to a channel that per Adobe’s Q1 2026 report, is converting at record rates and growing fast. If you’re also watching your content decay as rankings shift, both signals matter equally.
The Core SEO KPIs That Still Matter
These six metrics belong on every SEO dashboard in 2026. None of them have become irrelevant, they’ve just been joined by a second instrument panel.
1. Organic Conversion Rate
Rankings without conversions are vanity. This is the KPI that ties SEO effort to real business outcomes.
Divide organic conversions by organic sessions, multiply by 100. Simple formula, but “conversion” needs to be defined per business: free trial or demo for SaaS, qualified form fill for B2B, purchase for e-commerce. Industry benchmarks: e-commerce 2–3%, B2B 3–5%, SaaS 5–7%. Use your own baseline as the comparison point, the sector averages are context, not gospel.
In GA4, track conversion events rather than legacy goals. The numbers are cleaner.
2. Organic Traffic (Engaged Sessions, Not Raw)
Raw session counts lie. Bots, instant bounces, accidental clicks, they all inflate the number without adding signal.
In GA4, the metric you want is engaged sessions: sessions lasting 10+ seconds, triggering a conversion event, or including two or more pageviews. That filters the noise. Benchmark: 5–10% month-over-month in steady state, 15%+ during active content pushes.
Pair it with a branded vs non-branded split. Growing non-branded organic means you’re expanding reach to new audiences. Growing branded-only means you’re deepening loyalty but not adding new discovery, which matters if growth is the goal.
3. Click-Through Rate (CTR)
Pull CTR from Google Search Console. Not from third-party CTR curve estimates, those haven’t been updated for AI Overview-heavy SERPs.
Flat CTR is not always a flat result. If an AI Overview appeared on your key queries, your click potential dropped even if your ranking didn’t shift. Always look at CTR alongside impression trends.
Rough benchmarks: 3–5% for informational queries; 8–15%+ for branded navigational terms.
4. Keyword Rankings (Top-3, Top-10, Page 2+ Split)
Track rankings in three buckets, not as a blended average. Top-3 captures most available clicks. Top-10 is visibility. Page 2+ is your opportunity list, terms close enough to the first page that a content update or link push can move them.
Google rolls out an estimated 500–600 algorithm updates per year. That’s a lot of noise. Automated weekly tracking via Ahrefs, SEMrush, or Search Console lets you catch significant rank movements before they compound into traffic losses. Using AI SEO agents for automated rank monitoring reduces the manual overhead significantly.
One thing worth checking: are your high-intent commercial pages ranking, or just your blog content? A blog post at position 2 and a conversion page at position 11 means you’re visible but not earning.
5. Core Web Vitals (LCP, INP, CLS)
Good thresholds in 2026: LCP ≤ 2.0 seconds, INP ≤ 200 milliseconds, CLS ≤ 0.1. Scores are measured from real Chrome user data and take 4–6 weeks to reflect in the Search Console after you make improvements.
Only 47% of websites pass all three “good” thresholds right now. Pages loading under 2.5 seconds show bounce rates 24% lower, engagement that feeds the ranking signals that count. When content quality is equal between two competing pages, Core Web Vitals is often the tiebreaker.
There’s a newer angle: a December 2025 analysis found that sites with poor Core Web Vitals scores rarely appear in AI-generated responses. Slow pages lose both organic and AI-cited traffic.
6. Branded vs Non-Branded Traffic Split
Most SEO reports track total organic traffic. The more useful cut is the branded vs non-branded split.
Non-branded organic is discovery, people finding you via category or problem queries. Branded search is familiarity and recall. A rising branded share without growing non-branded means you’re deepening loyalty, not expanding reach. Also worth knowing: branded search volume tends to rise downstream when your AI mention rate improves. It’s one of the clearest leading indicators that AEO work is paying off.
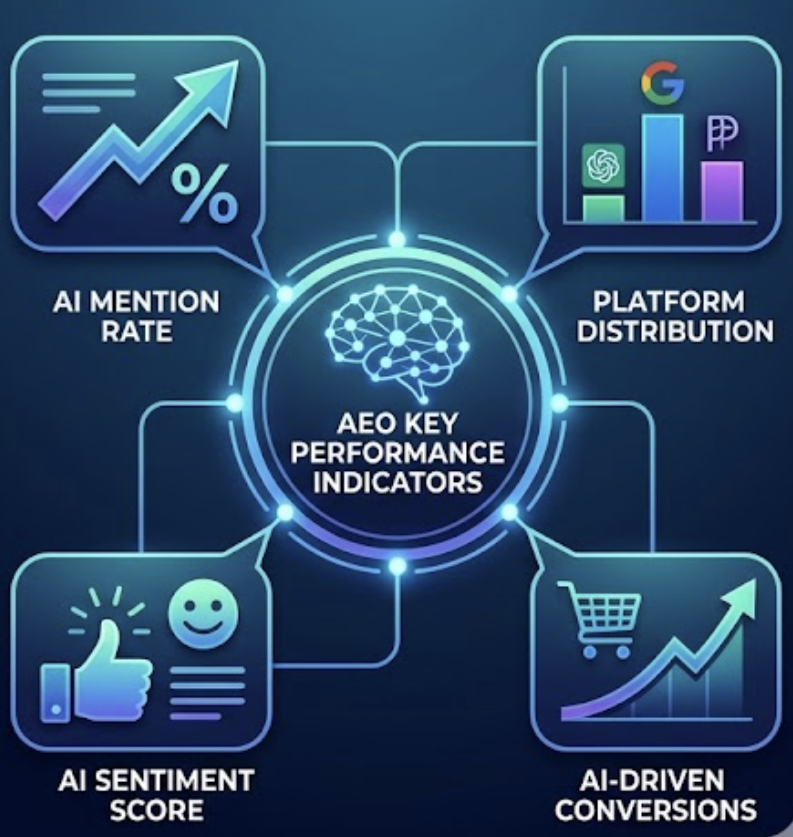
The AEO KPIs You Can’t Afford to Ignore
Traditional SEO metrics measure performance in a list-based world where clicks are the signal. AEO metrics measure performance in a synthesized-answer world where presence and authority are the signal. Different tools. Different logic.
Here’s what to track.
This is the AEO equivalent of keyword rankings. It measures the percentage of your target prompts where your brand shows up in an AI-generated response.
For B2B SaaS, a healthy baseline falls between 10–15% of relevant category queries. Category leaders typically exceed 30%. Build a list of 50–100 prompts across your buyer journey, problem-based questions and category comparison questions both and track them weekly.
Useful distinction: a mention means the AI knows your brand exists. A citation means your content grounded the response. Both matter, for different reasons.
8. Platform Distribution (ChatGPT vs Perplexity vs Gemini)
An analysis of 680 million AI citations found only 11% of domains get cited by both ChatGPT and Perplexity for similar prompts. Less than 1% on specific queries.
These platforms pull from completely different source pools. A content strategy tuned for Perplexity doesn’t automatically carry over to ChatGPT or Gemini. If you’re measuring AI visibility as a single blended number, you’re probably invisible on two of the three platforms you care about.
Track mention rate per engine separately. The splits show which channels you’ve been accidentally ignoring. For teams managing this alongside content refresh work, WordPattern’s topical authority builder can surface the content gaps that are keeping you out of AI citation pools.
9. Prompt Coverage
Your brand might appear for “email marketing software” and completely disappear for “email marketing software for small retailers.” That gap is the prompt coverage problem.
Cover three buyer journey stages (awareness, consideration, decision) and multiple use-case angles. Coverage below 50% on commercial-intent prompts is a signal your content has blind spots. The fix is content, not just keyword optimization.
10. AI Sentiment Score
Being mentioned is not the same as being recommended. AI systems list multiple options for category queries, you might be third on the list with a generic descriptor, or first with a strong positive framing.
Track the language AI platforms use when describing your brand over time. Positive descriptors (“reliable,” “widely adopted,” “built for X use case”) translate to influence even when no click follows. If the description doesn’t match your positioning, that’s a content problem to solve.
11. AI-Driven Traffic and Conversion Rate
The most tangible AEO KPI, and the one that most directly connects to revenue.
AI-referred traffic to US retailers grew 393% year-over-year in Q1 2026 per Adobe Digital Insights. And the quality is striking: AI visitors spent 48% longer on site, browsed 13% more pages, and generated 37% higher revenue per visit versus non-AI sources.
The conversion story flipped entirely in 12 months. In March 2025, AI traffic converted 38% worse than other channels. By March 2026,it converted 42% better, a record high. The explanation is pre-qualification: a user who clicks through from ChatGPT has already researched inside the AI interface and narrowed their choice. They arrive ready to act.
Track AI referral traffic in GA4 by segmenting source/medium for chatgpt.com, perplexity.ai, and gemini.google.com. A small but high-converting slice of traffic deserves its own row in your dashboard.
How to Report on Both Without Drowning in Data?
The biggest mistake is building two separate dashboards and never connecting them. SEO and AEO reinforce each other. Strong non-branded content improves both organic rankings and AI citation frequency. Rising branded search is often a downstream signal of improving AI mention rate.
A simple reporting cadence that keeps both in view:
Weekly: AI mention rate (week-over-week delta), keyword rank shifts for top 20 target terms, CTR for priority pages.
Monthly: Organic traffic and engaged sessions, organic conversion rate, Core Web Vitals status, platform distribution by AI engine, AI-driven traffic volume and conversion.
Quarterly: SEO ROI and organic revenue attribution, prompt coverage review, AI sentiment audit, backlink profile growth.
The simplest version: one shared doc or Slack message every Monday with five numbers. AI mention rate, organic traffic, conversion rate, average CTR, and the single most interesting rank movement of the week. Five minutes to update. Enough signal to catch issues early.
The Dashboard Has Split
Traditional search still sends traffic. But it’s sharing the road with AI-generated answers, and that second channel is growing fast and converting at record rates.
The teams building durable organic growth in 2026 aren’t choosing between SEO and AEO. They’re measuring both, organic conversion rate and AI mention rate side by side, Core Web Vitals and prompt coverage in the same weekly review.
Start with the SEO fundamentals. Then layer in AI mention rate and platform distribution. The baseline you set today is the comparison point that makes next quarter’s results mean something.
FAQs
An SEO KPI measures performance in traditional search — rankings, organic traffic, CTR, and conversions from blue-link results. An AEO KPI measures performance in AI-generated answers, how often your brand is mentioned, which platforms cite you, how you’re described, and whether AI referral traffic is converting. Both matter in 2026 because traditional search and AI search now run in parallel, with different logic and different measurement tools.
Start manually. Build a list of 20–30 target prompts and check them in ChatGPT, Perplexity, and Gemini once a week. Log appearances in a simple spreadsheet. Tools like Topify, Profound, and Brand24’s AI monitoring feature can automate this at scale, but a manual baseline beats no baseline.
Yes, and the competitive gap is wide. Only 47% of websites currently pass Google’s “good” thresholds for all three metrics. When content quality is comparable between two pages, Core Web Vitals scores often serve as the tiebreaker. There’s also an emerging link between page performance and AI Overview eligibility, slow pages rarely appear in AI-generated responses.
Weekly for operational metrics (rank shifts, AI mention rate changes, CTR on key pages). Monthly for trend metrics (organic traffic, conversion rates, platform distribution, Core Web Vitals). Quarterly for strategic metrics (SEO ROI, full prompt coverage audit, AI sentiment review, backlink growth). Reviewing everything at the same cadence creates noise, weekly and monthly signals operate on different timescales and need different responses.